Research
Plant community distribution in the Arctic tundra: present and future
Authors: Venkata Shashank Konduri, Jitendra Kumar, Forrest M. Hoffman, Verity, G. Salmon, Colleen M. Iversen, Amy L. Breen, William W. Hargrove
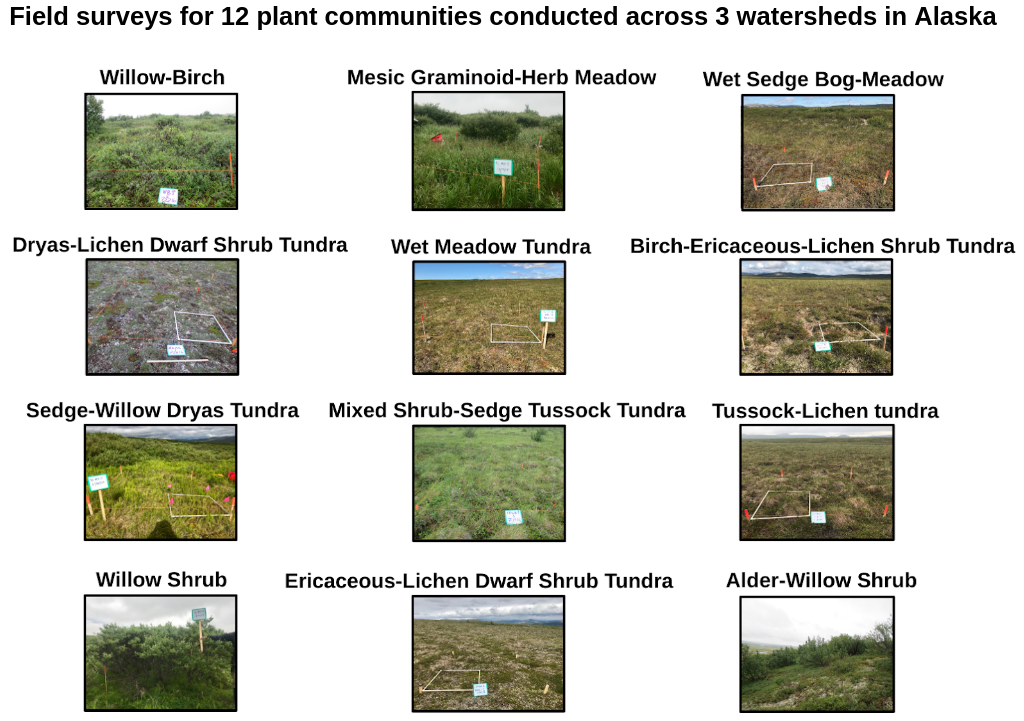
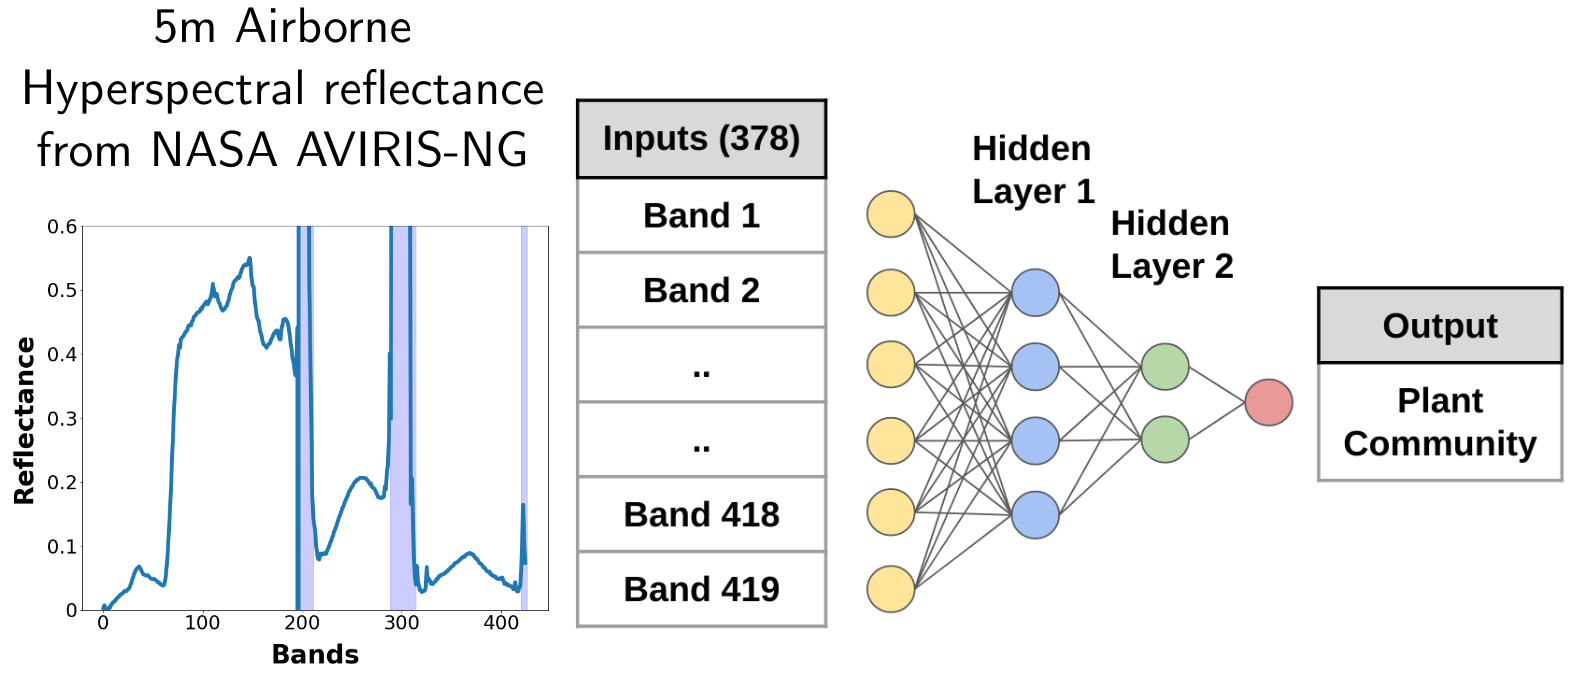
Abstract: Global warming is driving rapid changes in the vegetation composition, cover and productivity in the Arctic tundra. High resolution maps of vegetation distribution are crucial for studying the impacts of climate change on the functioning of Arctic tundra ecosystems and the associated feedbacks. Knowledge of the environmental drivers controlling current plant community composition and distribution is necessary for modeling potential shifts under a warming climate. This study aims at understanding the current composition, configuration and potential changes in the plant community distribution by mid-century time scales across the Seward Peninsula region of Alaska, USA. We developed a Deep Neural Network-based classifier, trained on data collected as part of field vegetation surveys and airborne hyperspectral imagery from NASA AVIRIS-NG, to create high-resolution (5m) land cover maps with an accuracy exceeding 93%. Analysis of landscape patterns, using area and aggregation based metrics, show that plant communities such as Willow-birch shrub and Tussock-lichen tundra occupy a greater proportion of the landscape and are more spatially aggregated compared to Mesic graminoid-herb meadow tundra and Wet sedge bog-meadow. Using a Random Forest-based environmental niche model, we found that climate drivers such as mean summer temperature as well as microtopographic features such as elevation and downstream distance were strong drivers in determining plant community distribution. High resolution maps of vegetation types would improve our knowledge of above-ground trait variability in tundra ecosystems and could serve as datasets for Earth system model parameterization, benchmarking and validation. Insights from niche modeling could help improve our knowledge of mechanisms and environmental drivers of vegetation distribution.
Slides: Oral presentation at AGU 2019
Code: Github
Mapping Crops Within the Growing Season Across the United States
Won the 1st place poster presentation among student entries in the hydrology section of the American Meteorological Society (AMS) annual meeting 2020
Authors: Venkata Shashank Konduri, Jitendra Kumar, William W. Hargrove, Forrest M. Hoffman & Auroop Ganguly
Journal: Remote Sensing of Environment
Abstract: Timely and accurate knowledge about the geospatial distribution of crops at regional to continental scalesis crucial for forecasting crop production and estimating crop water use. The United States (US) is one of the leading food-producing countries, but lacks a nationwide high resolution crop-specific land cover map available publicly during the current growing season. The goal of this study was to map crops across the Continental US (CONUS) before the harvest, and to estimate the earliest date of classification by which crops can be mapped with sufficient accuracy (90% of full-season accuracy). The study employed a scalable cluster-then-label model that was trained on multiple years of MODIS NDVI using ground truth data in the form of US Department of Agriculture (USDA) Cropland Data Layer (CDL) products.
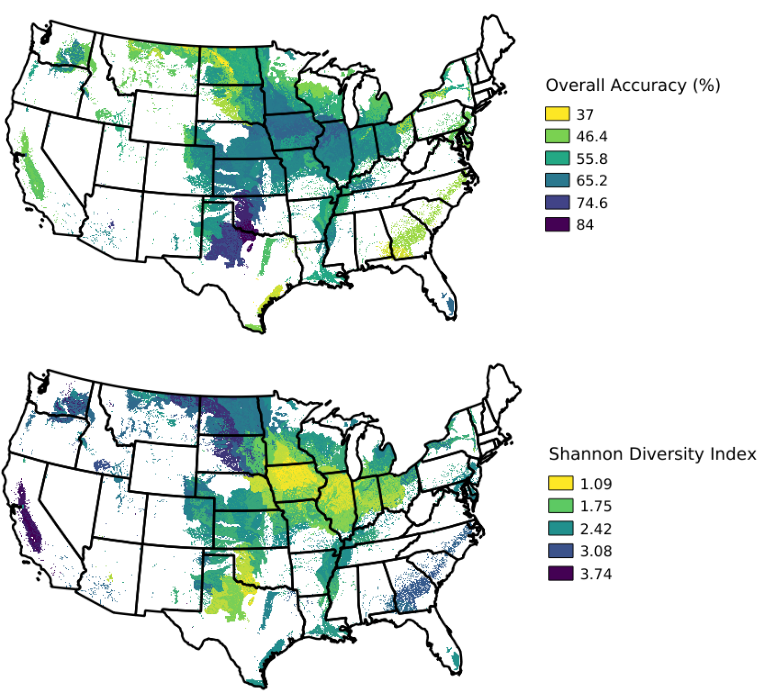
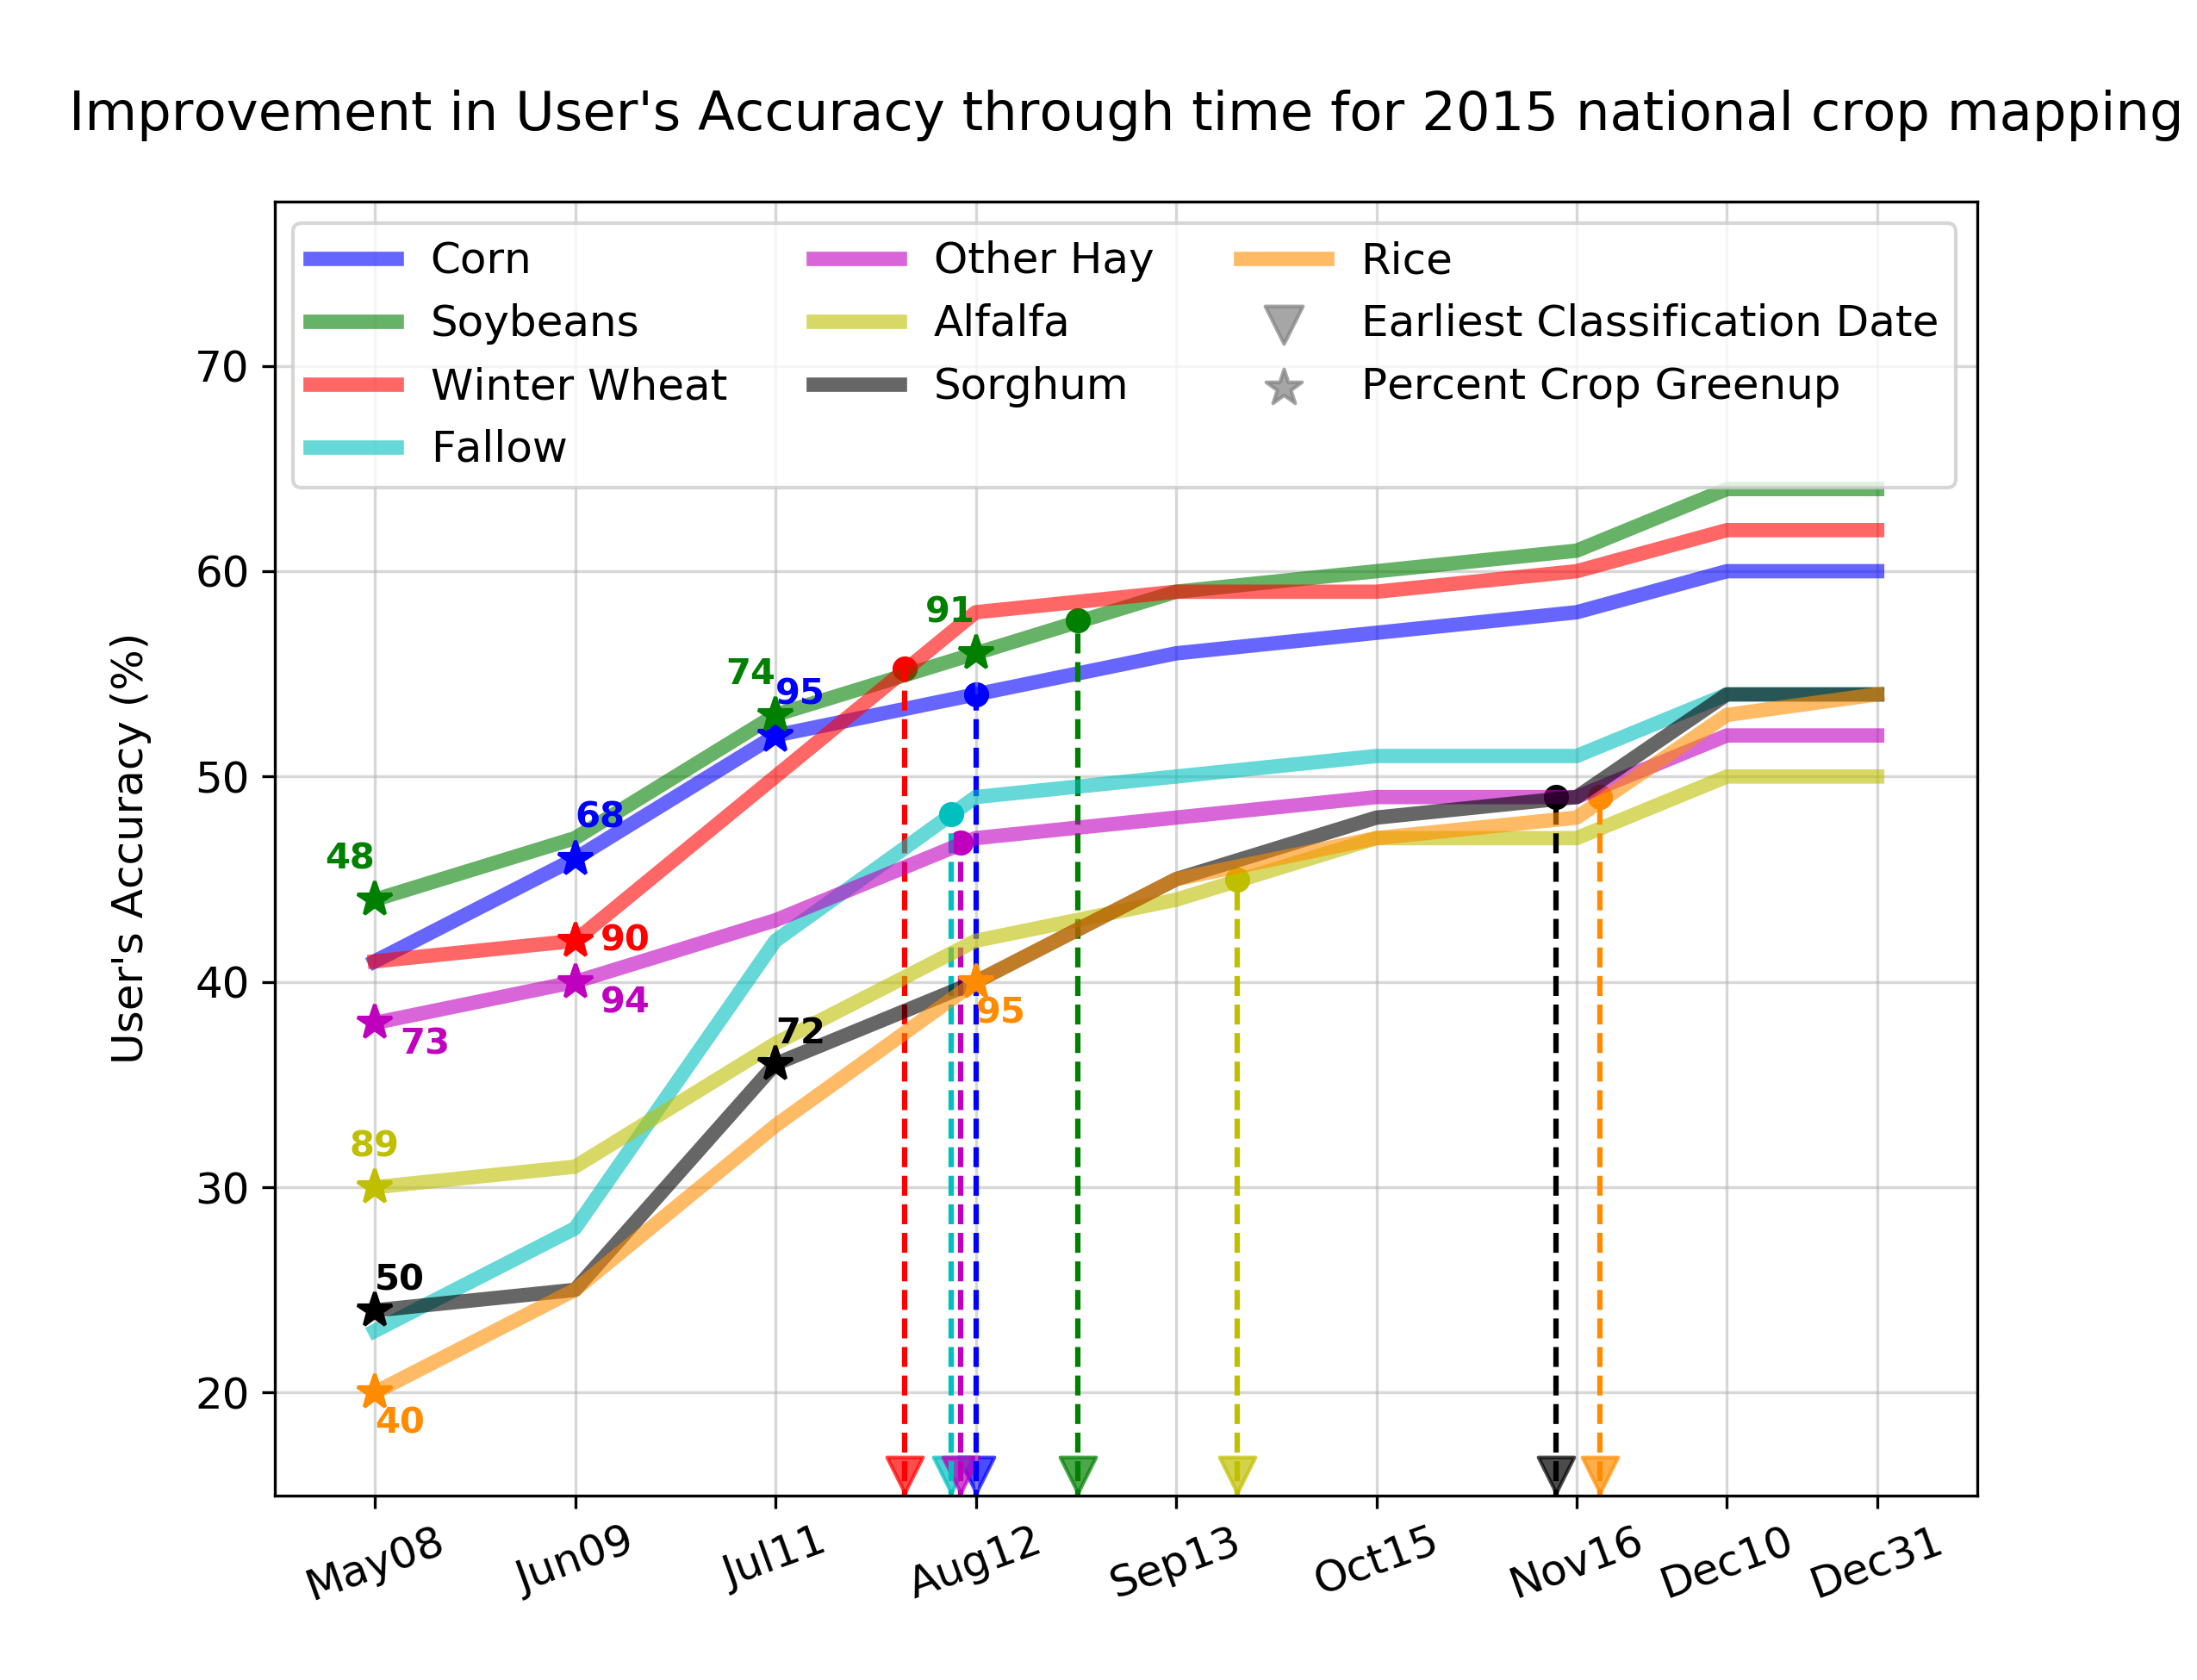
The first step in the crop classification was to perform Multivariate Spatio-Temporal Clustering (MSTC) of annual MODIS-derived NDVI trajectories to create phenologically similar regions, or phenoregions. The second step was to assign crop labels to phenoregions based on spatial concordance between phenoregions and crop classes from CDL using Mapcurves. Assigning crop labels to phenoregions was performed within ecoregions to reduce classification errors due to spatial variability in phenology caused by variations in climate, agricultural practices, and growing conditions. The crop classifier was trained and validated on the years 2008–2014, then tested independently on 2015–2018. Ecoregion-level crop classification performed better than state-level and CONUS-level classification. Pixel-wise accuracy of classification for eight major crops by area was around 70% across the major corn-, soybeans- and winter wheat-producing areas, whereas regions characterized by high crop diversity had slightly lower accuracy. Classification accuracy for dominant crops like corn, soybeans, winter wheat, fallow/idle cropland and other hay/non alfalfa improved with time as they grew, reaching 90% of year-end accuracy by the end of August over each of the four unseen years in the test period. For corn and soybeans, the earliest dates of classification were found to be much earlier in the central regions of the Corn Belt (parts of Iowa, Illinois and Indiana) than in peripheral areas. The ability to map growing crops may permit near real-time monitoring of the health status and vigor of agricultural crops nationally.
Paper: https://doi.org/10.1016/j.rse.2020.112048
Code: Github
Data Science for Weather Impacts on Crop Yield
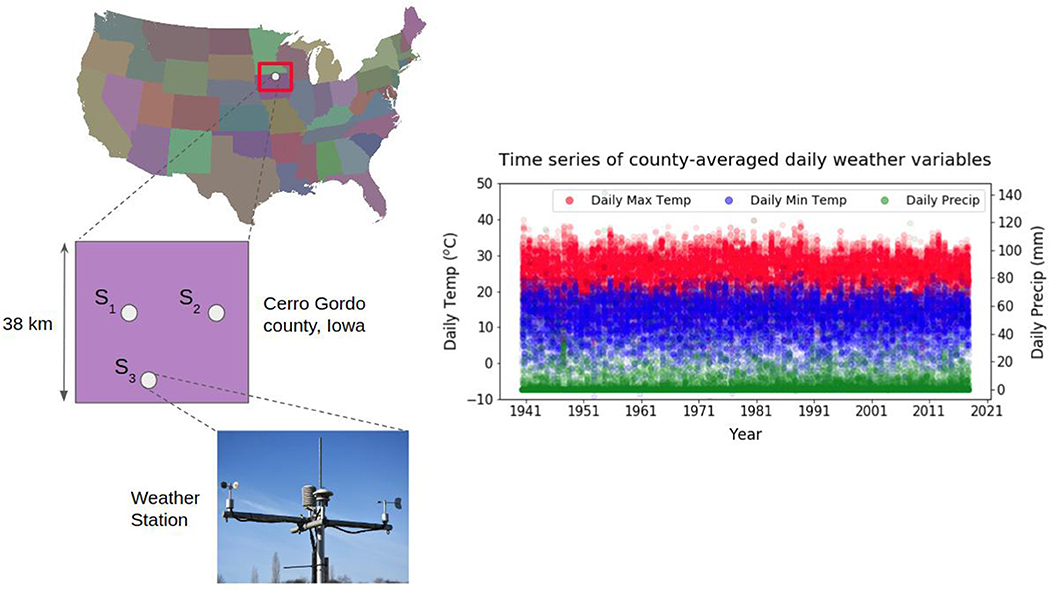
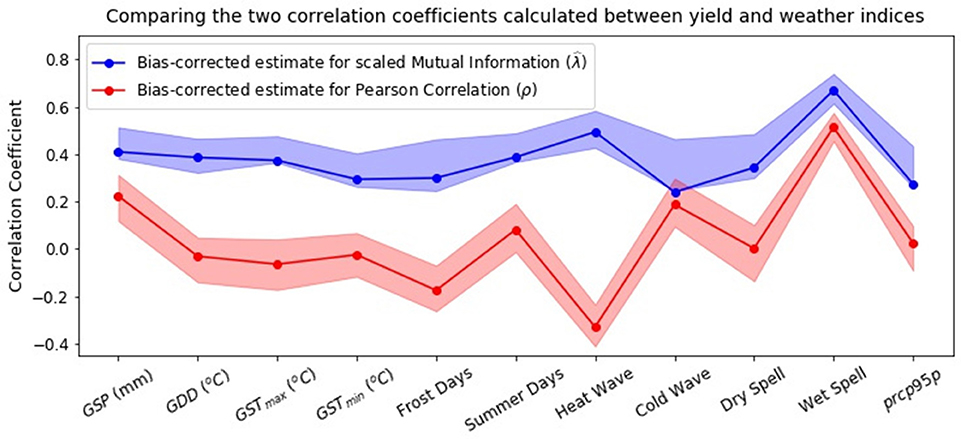
Authors: Venkata Shashank Konduri, Thomas Vandal, Sangram Ganguly and Auroop Ganguly
Journal: Frontiers in Sustainable Food Systems
Abstract: Private businesses in sectors, such as food, energy, and retail, as well as public sector and federal agencies are interested in the predictive understanding of weather impacts on crop yield, which is an important aspect of food security. Scientific literature has mainly examined how crop yield is impacted by growing season-averaged weather indices. Although a few studies did consider weather extremes in their analysis, their scope was either restricted to measuring their conditional relationship with yield or the extreme event types considered were limited. Selection of regression models, whether the more commonly used linear approaches or nonlinear methods, have not been appropriately justified in this context. Here, we develop data-driven methods to examine two inter-related hypotheses for improved scientific understanding and enhanced predictive modeling. The first hypothesis, that extreme weather indices have a statistically significant information content in them is found to be valid based on linear and nonlinear methods for pairwise dependence. The second hypothesis, examines the value addition of nonlinear regression methods, and suggests that linear approaches may not alone be adequate. The results of this study can inform scientific understanding, generation and relevance of indices and end-to-end risk assessment systems in the context of climate impacts on crop yield. An immediate application may be in the context of NASA Earth Exchange (NEX) which facilitates the generation and dissemination of impacts relevant weather data and indices using a multitude of satellite-derived data sets and model outputs.
Paper: https://www.frontiersin.org/articles/10.3389/fsufs.2020.00052/full
Code: Github